Building MIRACLE involves two main challenges. The first is finding the yearbooks. No central archive holds them all, and most surviving volumes, especially the earlier ones, are scattered across county offices. The project scans surviving volumes on site at the National Archives of Korea, major libraries and county offices. The second is turning scanned pages into usable data. MIRACLE has developed an OCR pipeline that cross-checks three pretrained document-AI models against the tables' own printed totals. This keeps accuracy high at scale, and each release will report a measured error rate. A single identifier (miracle_id) follows each township through boundary changes, including the major reorganisations of 1963 and 1973.
The Korean panel is the first phase of a longer-term effort to reconstruct the local economic histories of growth miracles. Future phases would extend it along three dimensions.
Each country would move through the phases at its own pace.
- Time depth. Link the same townships to colonial-era records, so that conditions before the growth take-off can be measured in the places where growth later happened.
- Data depth. Add census and firm-level records where access allows, connecting places to the people and firms within them.
- Geographic breadth. Extend the approach to other economies with comparable archives, such as Taiwan and Singapore. The pipeline needs only a few hundred hand-keyed pages to set up on a new collection, which is what makes this feasible.
These are plans rather than commitments. Each depends on access to the records and on local partners.
- Municipal Statistical Yearbooks 통계연보 Core — digitising now
Township-level demographics, agriculture, industry, infrastructure, public finance, and education. Published annually by county governments. - Forest Type Maps 임상도 Collected
Korea Forest Service spatial archives. Shapefiles available from 조선임야분포도 (1910) and forest type maps from 1974 onward. Enables studying one of history's largest reforestation programmes. - New Village Survey 새마을총람 Collected
Comprehensive village-level survey published in 1972 by the Ministry of Home Affairs (내무부). Covers all ~35,000 villages with township-level maps, distance tables, and detailed statistics on households, population, land, and infrastructure. Led and digitised by Hyunjoo Yang (Advisor, Sogang University). - Future archival layers (not yet in active digitisation)
- Agricultural Extension Records Planned
Farm-level adoption of high-yield rice varieties and extension programme participation. - Expressway Construction Logs Planned
Construction timelines and route data for the Gyeongbu Expressway and subsequent motorway network. - Personnel Files Planned
Local government personnel records. Bureaucratic capacity and institutional quality measures.
MIRACLE draws on multiple archival source types. Municipal statistical yearbooks form the backbone; additional layers are planned.
Municipal Statistical Yearbooks Core — digitising now
Township-level demographics, agriculture, industry, and public finance. Published annually by every county government.
Forest Type Maps Collected
Korea Forest Service spatial archives from 1910 and 1974 onward. Enables research on large-scale reforestation.
Expressway Construction Logs Planned
Construction timelines and route data for the Gyeongbu Expressway and subsequent motorway network.
New Village Survey Collected
Comprehensive village-level survey published in 1972 by the Ministry of Home Affairs (내무부), covering all ~35,000 villages in South Korea. Led and digitised by Hyunjoo Yang (Advisor, Sogang University).
From archive to analysis-ready panel in seven steps.
Finding the yearbooks Done
No central archive holds the yearbooks. The National Archives of Korea hold a good number of volumes, but most surviving ones, especially the earlier years, are scattered across county offices. A systematic survey maps what exists, what is missing and where each volume is held.
Scanning on site Largely complete
Volumes are scanned on site with high-speed scanners, at county offices, the National Archives of Korea and major libraries.
Reading the tables Current focus
Three pretrained open document-AI models read every page, with no training on our pages. Each cell is then settled by a weighted vote. A model's weight depends on how accurately it reads that kind of content, measured against a set of hand-keyed pages.
| Custom-trained pipelinee.g. Layout Parser + EffOCR | Pretrained readers, cross-checkedMIRACLE | |
|---|---|---|
| How pages are read | A layout detector and a character recogniser, customised to the corpus | Three pretrained document-AI models read every page side by side |
| Setting up a new corpus | Label example layouts and characters, then train | Score candidate models on a few hundred hand-keyed pages, with no training |
| Where accuracy comes from | A better-trained reader | Disagreement between readers, refereed by the tables' own totals |
| Where people spend time | Labelling training data | Reviewing flagged cells and a random audit sample |
| Strongest when | Scripts or layouts no pretrained model knows, or very large uniform collections at the lowest cost | Varied layouts, mixed scripts, and tables with built-in totals |
Layout Parser: Shen, Zhang, Dell, Lee, Carlson & Li (2021). EffOCR: Carlson, Bryan & Dell (2024).
| 읍면 | 합계 | 논 (답) | 밭 (전) | ✓ | ||
|---|---|---|---|---|---|---|
| 소계 | 1모작 | 2모작 | ||||
| 남해 | 8,054 | 5,849 | 1,230 | 4,619 | 2,205 | ✓ balanced |
| 이동 | 10,993 | 7,544 | 1,175 | 6,369 | 3,449 | ✓ balanced |
| 삼동 | 12,785 | 7,349 | 1,239 | 6,110 | 5,436 | ✓ balanced |
| 남면 | 11,470 | 6,012 | 857 | 5,155 | 5,458 | ✓ balanced |
| 고현 | 8,310 | 5,680 | 743 | 4,937 | 2,630 | ✓ balanced |
| 창선 | 13,173 | 7,901 | 2,311 | 5,590 | 5,272 | ✓ balanced |
- 01 · ReadThree readersPretrained open models, no training on our pages
- 02 · ReconcileWeighted voteCell by cell, weights learned from hand-keyed pages
- 03 · RefereeTotals checkThe reading that balances row and column totals is kept
- 04 · AdjudicateModel reviewPicks a reading or flags the cell, never invents a number
- 05 · ValidatePanel checksJumps over time, township sums against county totals, figures across publications
- 06 · OutputTownship panelEvery number keeps its provenance
See structured output table above.
Checking the numbers Current focus
Each candidate reading is tested against the printed row and column totals, and the one that balances is kept. A frontier model reviews any remaining conflict and either picks a reading or flags the cell. It never supplies a number of its own. Panel checks then look for jumps over time, township sums that miss county totals, and figures that differ across publications. Research assistants review flagged cells and a random audit sample, which gives the measured error rate. Every number keeps its provenance.
Variable harmonisation Current focus
Definitions, units, and table structures changed across editions and municipalities. We build crosswalks reconciling these into consistent time series.
Boundary concordances Pilot complete
Two major reorganisations (1963, 1973) plus dozens of smaller changes. We construct time-consistent miracle_id identifiers.
Geocoding & GIS Pilot complete
Every township linked to satellite, elevation, slope, soil, and transport network data. 196 Namhae-gun villages fully geocoded.
The dataset is organised into modules by domain, each a flat township-year panel. Merge across modules using Core Keys. CSV, Stata & Python, with full codebook and variable documentation.
| miracle_id | year | prov | muni | twp | pop | hh | paddy_ha | schools | road_km |
|---|---|---|---|---|---|---|---|---|---|
| KR-48-840-010 | 1970 | 경남 | 남해군 | 남해읍 | 28,412 | 5,680 | 1,245 | 7 | 23.4 |
| KR-48-840-010 | 1975 | 경남 | 남해군 | 남해읍 | 25,891 | 5,320 | 1,198 | 8 | 31.7 |
| KR-48-840-010 | 1980 | 경남 | 남해군 | 남해읍 | 22,105 | 5,010 | 1,152 | 8 | 38.2 |
| KR-47-720-030 | 1970 | 경북 | 영주시 | 풍기읍 | 31,550 | 6,140 | 1,870 | 9 | 18.6 |
| Module | Description | Planned |
|---|---|---|
| Core Keys miracle_id · province · municipality · township · concordances | Geographic identifiers and boundary concordances across the 1963/1973 reorganisations. | 2026 |
| Demographics population · households · age structure | Population counts, household numbers, demographic composition. | 2026 |
| Agriculture paddy area · crop output · livestock | Cultivated area, output (harmonised to metric units), livestock. | 2026 |
| Industry establishments · employment · output | Industrial establishments, manufacturing employment, sectoral output. | 2028 |
| Infrastructure roads · electricity · water · telecom | Road length, electrification, public utilities. | 2028 |
| Public Finance revenues · expenditures · transfers | Municipal revenue/expenditure, central transfers, fiscal capacity. | 2028 |
| Education schools · enrolment · teachers | School counts, enrolment, teachers, educational infrastructure. | 2028 |
| Geospatial shapefiles · centroids · boundaries | GIS boundary files with consistent township geometries. | 2028 |
| Institutions clan concentration · bureaucratic capacity | Pre-treatment institutional measures from 1930 registries and personnel files. | 2029 |
The coverage map shows the status of every yearbook by municipality and year. A public explorer for the panel itself is in development.
Of the 4,356 yearbooks expected for 1960–1985, 3,249 (75%) have been scanned. A copy of a further 709 has been located, and 398 have not been found.
| Province | Scanned | Scanned or located |
|---|---|---|
| Seoul | 26 | 100% |
| Gyeonggi | 489 | 97% |
| Gangwon | 354 | 93% |
| N. Chungcheong | 238 | 92% |
| S. Chungcheong | 327 | 93% |
| N. Jeolla | 304 | 90% |
| S. Jeolla | 447 | 84% |
| N. Gyeongsang | 535 | 93% |
| S. Gyeongsang | 452 | 87% |
| Jeju | 77 | 97% |
| All provinces | 3,249 | 91% |
One yearbook per municipality per year. Last updated October 2026. Coverage by municipality
- 2023–24
- Source survey across provincial archives. First OCR pilots. Namhae-gun pilot, 196 villages geocoded. Collaboration with KDI School and Sogang University begins.
- 2025
- STEG and LSE seed funding. Systematic scanning begins. Variable harmonisation framework. Boundary concordance with the Academy of Korean Studies.
- 2026
- Reading pipeline rebuilt around three pretrained readers checked against printed totals. 75% of yearbooks scanned by October 2026. Pilot release for the Gyeongbu Expressway corridor, about 400 townships. Hiring research associates for 2027–28.
- 2027–28
- Planned. Scanning and reading towards national coverage. Industry, Infrastructure, Public Finance and Education modules, planned for 2028.
Growth miracles are usually studied as national events. Korea's transformation between 1960 and 1985 is among the best documented, yet most of the evidence on it comes from national or provincial statistics. MIRACLE's more granular data make it possible to date local change, compare places within the same province, and study mechanisms using variation that aggregates average away. Three projects using these data are under way. Further questions would require extending them back into the colonial period, into records of households and firms, and to other economies.
-
This paper introduces the MIRACLE panel and uses it to ask how geographically broad Korea's development was. It connects two debates. One concerns whether public services such as roads, electricity and schools were concentrated in favoured regions, as often claimed for the southeast under Park Chung Hee, or spread across the country. The other concerns whether manufacturing-centred growth came at the expense of agriculture and local commerce, or whether farm yields, mechanisation and commercial activity also rose in places that manufacturing did not reach. The paper dates the arrival of these services across townships, measures where manufacturing and other productive activity concentrated, and tracks where population grew and declined. It also shows how much of this variation county and provincial averages hide.
-
Whether higher farm productivity speeds industrialisation or slows it is a long-standing question in development economics. In a closed economy, more productive farms feed the country with fewer workers and release labour to industry. In an open economy, they strengthen comparative advantage in farming and hold labour on the land (Matsuyama 1992). Korea's rice market was closed to world trade but integrated within the country, so the answer could differ across townships. This project asks whether productivity gains led a township to commercialise its farming or to release workers into non-farm jobs and migration, and how that depended on its access to crop markets and non-farm employment. It combines event studies of reservoir completions and road paving, using MIRACLE's annual township records, with a spatial general-equilibrium model of Korea's structural transformation.
-
Large-scale planting programmes have a poor record, because planting does not remove the demand for farmland, grazing and fuelwood. Korea restored 2.8 million hectares of forest between 1962 and 1987 while industrialising from low income. This project asks two questions. First, did non-farm jobs and the switch to coal briquettes, by reducing dependence on forest land and fuelwood, make restoration more effective and more durable? Second, did recovered forests protect the economy around them, by reducing flood and landslide damage and raising agricultural output? The project links historical forest-type maps to MIRACLE's township records for the whole country.
Each topic below would require one of the extensions set out in the longer-term vision. We welcome collaborators on any of them.
-
Was Korea's postwar growth a continuation of colonial-era development or a separate process? The answer may differ between industry and agriculture. Were former Japanese-owned firms (귀속기업) the foundation of later industrialisation, or did industry grow largely from new firms? Were colonial irrigation associations (수리조합) the foundation of later gains in farm productivity, or did those gains come from postwar investment? Linking MIRACLE's townships to colonial-era records could show whether manufacturing and farm productivity later grew where these firms and associations had been. Separating the effects of these institutions from the advantages of the places that received them would draw on variation in where and when they were established, and on earlier benchmarks where they exist. Evidence of this kind could turn a debate that has often been ideological into an empirical one.
-
Does rapid growth create social mobility, or does it mainly reward families who already have land and schooling? Linked census records would make it possible to follow children from the households and townships where they grew up to their schooling, occupation and residence as adults. This would show how households invested in their children's education, whether that investment differed between sons and daughters or with landholding, and how it shaped who migrated. Together with MIRACLE's dates for the arrival of schools, roads and factories, it would show how far a child's schooling and occupation depended on the place and age at which these changes came. It would also measure how much of Korea's structural transformation came from a better-educated generation entering new occupations rather than from workers changing jobs.
-
Do growth miracles share common local mechanisms, or does each follow its own path? Property rights are one test. Japanese colonial rule surveyed and titled land in Korea and Taiwan, and land reforms followed after 1945, while in Singapore, a former British colony, the state became the main landowner. How did formal property rights spread across places, and did places that gained them earlier develop differently? The transmission of knowledge is another test. Japan's codification of Western technical knowledge in the Meiji period allowed it to absorb the technologies of the Industrial Revolution (Juhász, Sakabe and Weinstein 2026), and terms coined in Chinese characters could be read in Korea and Taiwan. Did this knowledge spread through colonial schools, ports and factories, and did Singapore, with English as its language of administration, follow a different route? Applying the MIRACLE approach to comparable archives would allow these questions to be studied within each economy and compared across them. In time, the same approach could test whether these mechanisms hold beyond East Asia.
-
Does economic development generate demand for democracy, or does democracy generate growth? Korea democratised in 1987 after a generation of rapid growth under authoritarian rule, but some forms of local participation came earlier. Protestant missions established some of the country's earliest organisations based on broad participation, and the Saemaul Movement's village councils may have built experience of collective decision-making. Did these institutions raise local growth and later political mobilisation? Or did demand for democracy grow out of urbanisation, schooling, and a growing middle class and industrial workforce? Each channel implies a different geography and timing of political mobilisation. Linking MIRACLE to local returns from national elections and records of associations would allow them to be compared, and would help show whether the 1987 transition was a rupture or the outcome of changes already under way.
-
Infrastructure investments generate widely varying returns across similar communities. This paper argues the heterogeneity is structural: the same infrastructure shock leads communities to adopt fundamentally different development strategies depending on their social institutions. I study the 1973 Namhae Bridge in rural South Korea using village-level panel data spanning all villages in Namhae County. The bridge made rice modernisation profitable, but capturing those gains required feeder roads. Road construction demanded permanent land donations from every landholder along the route, a classic anti-commons problem that had been latent when transport costs were prohibitive. Cohesive villages, those dominated by a single patrilineal clan, assembled the land, built roads, and mechanised rice production. Fractionalised villages pivoted to labour-absorbing cash crops that required no shared infrastructure. Both paths raised household income, but through different factor-intensity channels, demonstrating that infrastructure and social organisation are institutional complements that determine not just how much communities gain from market access, but how they transform.
If you are using or interested in using MIRACLE data, or would like to work on any of these questions, we would like to hear from you. Get in touch.
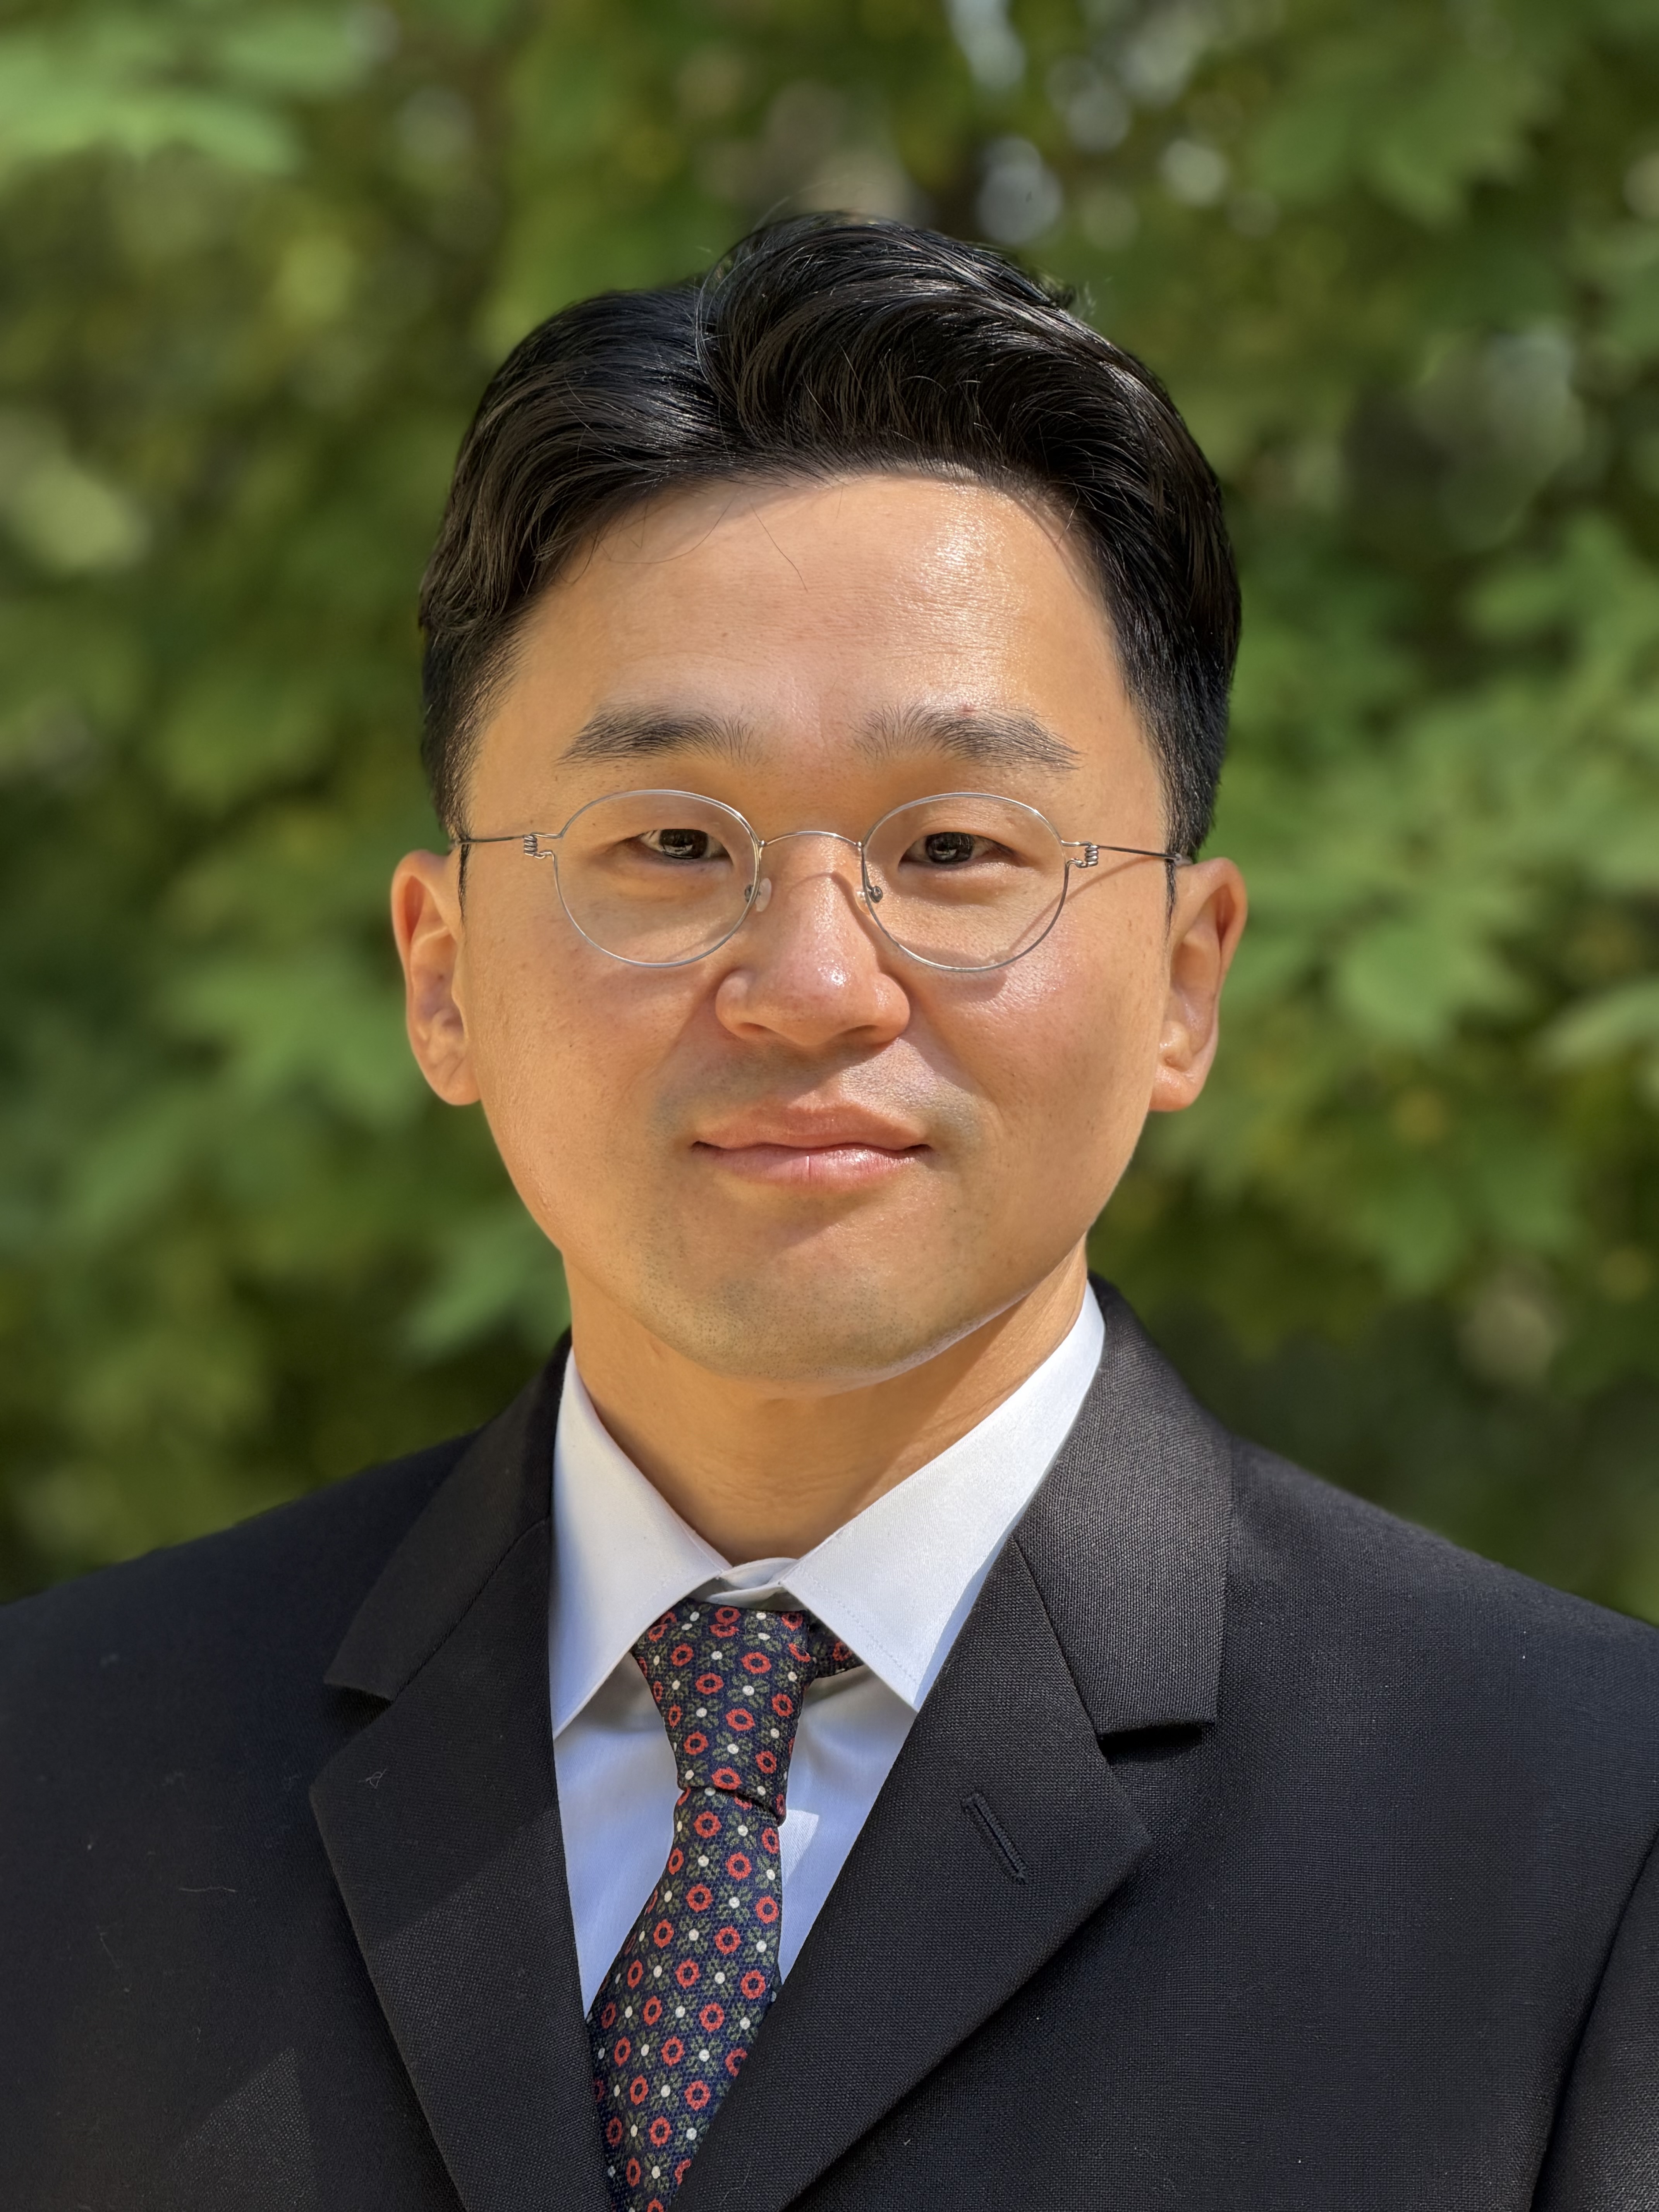
Project Lead
- Position
- Postdoctoral Fellow, Department of International Development, London School of Economics
- Education
- PhD in Economics, Columbia University
- Fields
- Development, economic growth
- Interests
- Structural transformation, industrial development, market access
- [enable JavaScript]
- CV
- CV (PDF)
Advisors

Research Associates

Hoyeon Byun

Inhwan Park

Yoorim Son
Hiring research associates for 2027–28. Get in touch.
Collaborating institutions


Funded by


For early access, collaboration, or questions — [enable JavaScript]